Every month receive an updated report on operator sentiment to help you keep tabs on the industry.
Segment Insights
Key differences between operators
will set your messaging and
support apart
Industry at a Glance
See the industry from top to bottom with decision maker profiles for each market segment
Thousands of foods,beverages, spices, andingredients
Access consumer ratings in an instant
Find the right
target
Analyze any item by gender, generation, region, ethnicity, and more
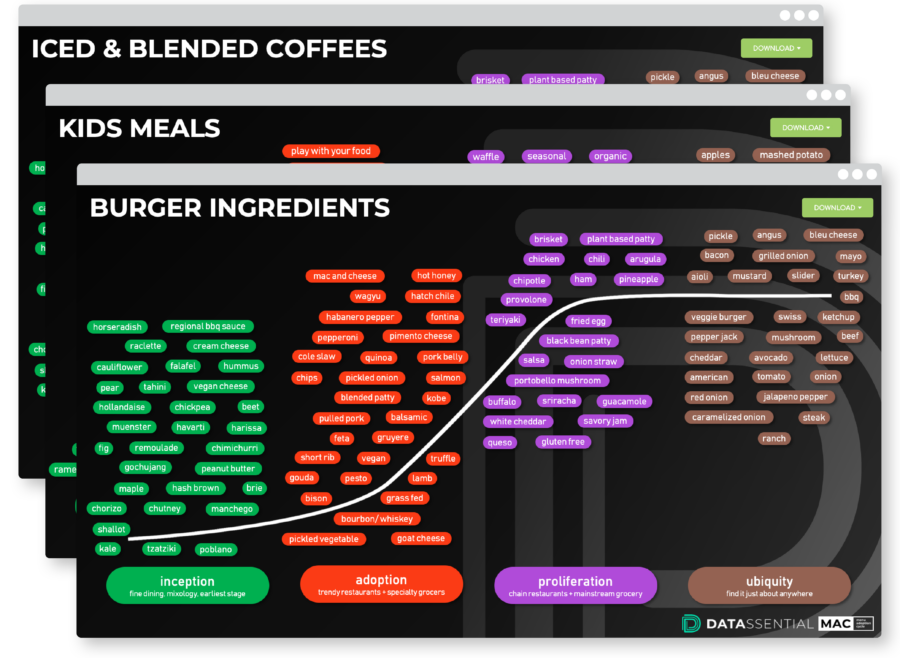
The Menu Adoption
Cycle
Quickly see where any food or flavor falls in its lifecycle, from Inception through Ubiquity.
Get into the mind of operators with deep insights
Move beyond high-level landscape analysis and investigate the challenges and needs of operators with an intensive dive into segment specific insights – build your best messaging and support yet.
Keep tabs on every aspect that drives operators – from the latest food trends to the most recent shifts in government regulations. The monthly sentiment report helps you keep up-to-date on operator sentiment and industry optimism. Paint a full picture of the foodservice industry, one segment at a time.
TRY IT

What consumer know.
What they LOVE.
Are the flavors on your menu or in your packaged goods in line with today’s rapidly changing consumer tastes? FLAVOR can help you determine that and much more. Easily spot the foods, ingredients, and beverages that people love. It’s the ONLY solution with 3,000+ foods listed and fresh consumer feedback on each one. FLAVOR keeps you on the right track throughout the entire menu development process, allowing you to answer questions about the foods that resonate with your consumers, the dishes and ingredients you should focus on; and the concepts that should be tested.

TRY IT
Consumer data in no time
Quickly search for any food or spot flavors by category. When you pull up the FLAVOR’s dashboard, you’ll immediately see the percentage of consumers that know, tried, and love a flavor. Take a deeper dive into the data – simply scroll down further and you’ll find a breakdown of demographics from gender to household income and even the consumers who frequent certain chains or use products. It’s so easy.