The world of food is constantly changing, and the speed of that evolution is only getting faster. Even the most innovative food brands are constantly reexamining their response to and adoption of growing technology and changing consumer preferences. Some brands are more successful than others, but the reasons for that success aren’t always obvious—or easy to apply to your chain restaurant.
Below, we take a deeper dive into the varying factors of success for three leading operators, analyzing what makes them consistent segment leaders and showing you what Datassential’s custom tools can reveal about the differences between those outperformers and their respective competitors.
The difference-maker
Every successful company has its own nuanced recipe for driving brand loyalty, but each is designed around a single crucial ingredient: customer data. Datassential’s Brand Fingerprints can be the key to gaining a deeper understanding of consumer perceptions about your brand and your competitors. The tool allows operators to perform an in-depth analysis on what metrics are making the difference for industry leaders, from loyalty and menu ratings to the ability to filter consumer rankings by age, gender, ethnicity, or other key demographics. Then, you can use custom competitive selections to examine the real differences between performers and standouts in any given industry segment.
Brand Fingerprints looks at the three main segments of success: journey (how a customer goes from first-timer to fan), advocacy (spreading your brand message), and menu. Or as we like to call it, “JAM.”
Journey
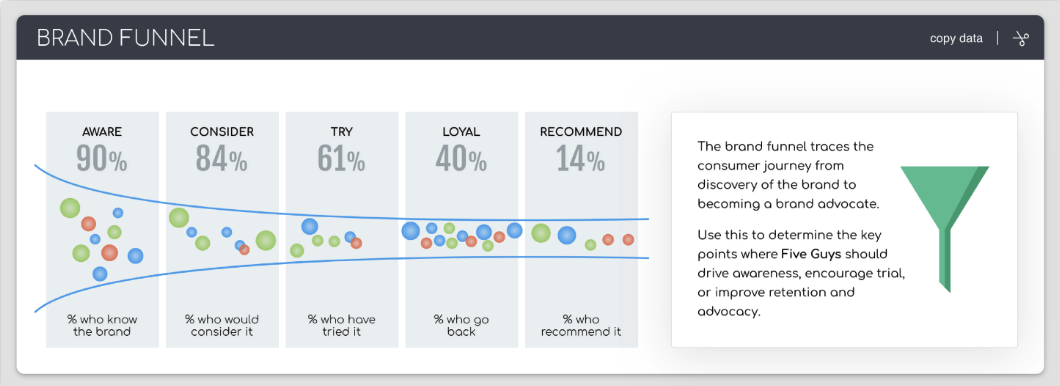
Every brand hopes that most customers will be converted to loyal and vocal fans. We measure how each brand and its competitors do this in five stages:
- Aware
- Consider
- Try
- Loyal
- Recommend.
We call the journey through these phases “The Brand Funnel” to visually show the journey that a customer takes. Even the most successful brands can vary widely on how fast they convert a customer, but the key is moving more customers than not through the funnel to turn them into advocates for the brand.
Advocacy
Advocacy is the highest stage of customer brand loyalty. The Net Promoter Score (NPS) helps brands track how loyal their customers are by assessing the likelihood a customer would recommend the brand to a friend. With this metric, companies are able to maintain a dynamic understanding of their brand and how consumers perceive and respond to it. Here is a sample breakdown of one chain restaurant’s NPS and how it shows where they can improve (or if looking at a competitor’s NPS, where they can find a differentiation point).

Menu
Chain restaurants are always working to build a menu that balances innovative and creative dishes and with popular, broadly-appealing staples. The most successful brands use concrete analysis to balance their menus with standouts and old standbys.
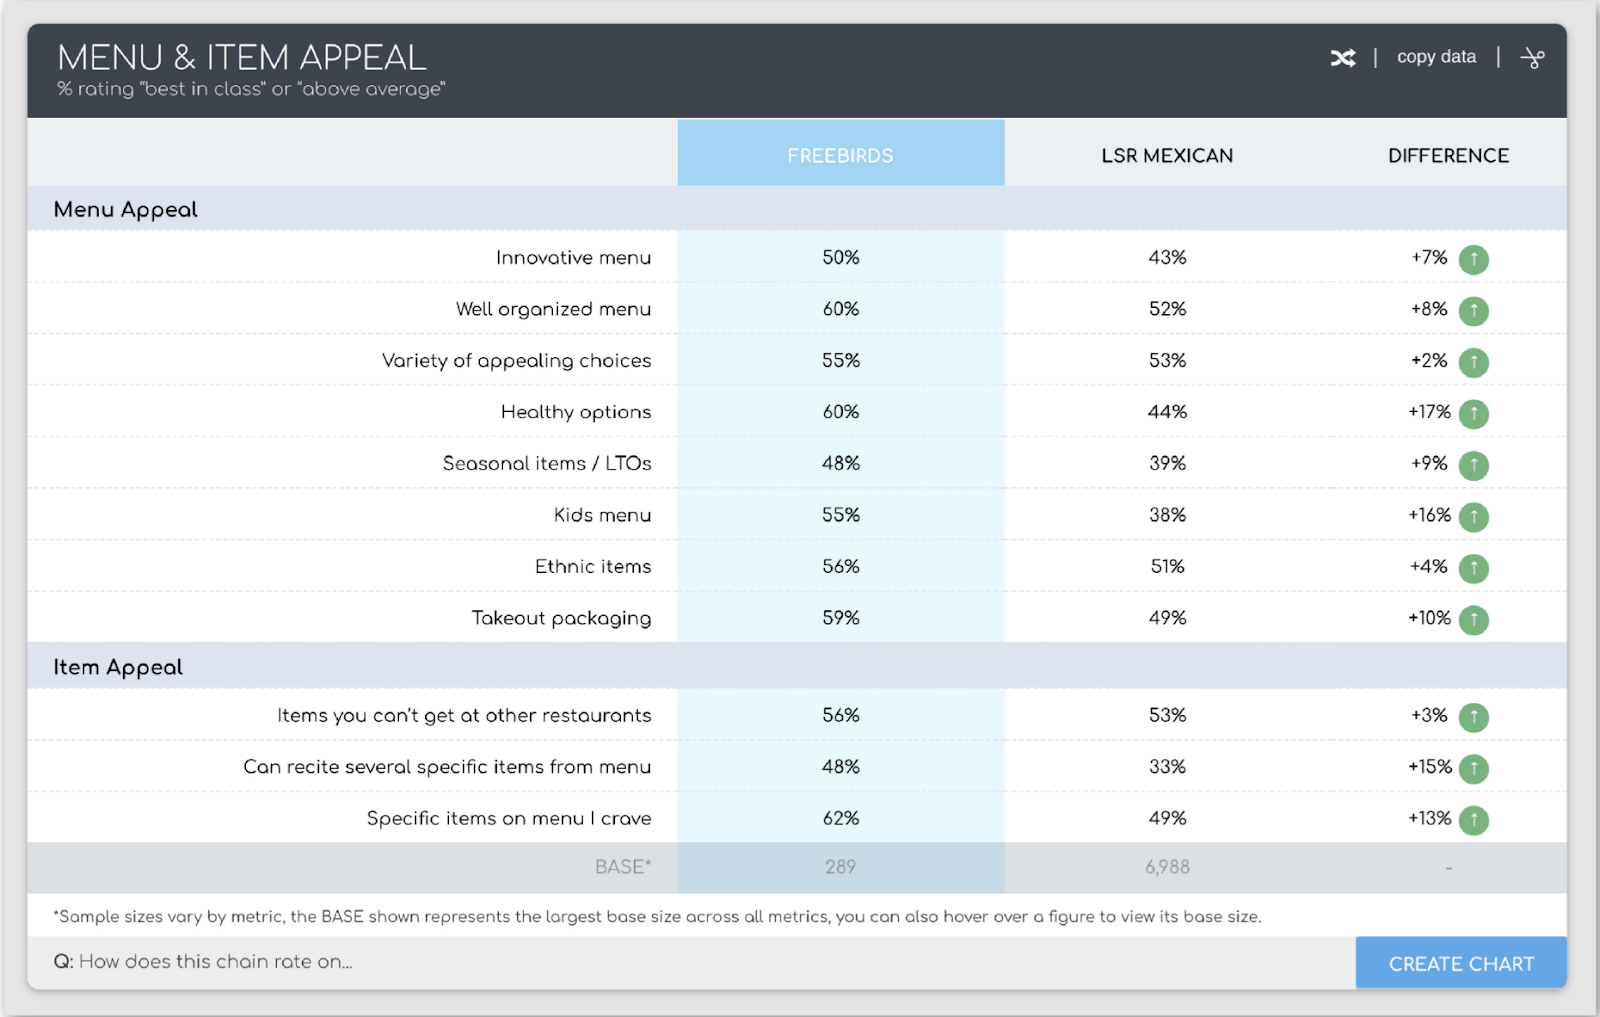
Now that we’ve shown how the best brands analyze the customer journey and convert passive customers into brand fans, here are examples of three chain restaurants that do it best.
Chick-fil-A
Chick-fil-A has built segment-leading brand loyalty over the years by focusing on two key attributes that are proven drivers of conversion: ingredient quality and customer experience. By delivering a superior experience at both the table and in the drive-thru, Chick-fil-A has ensured a high rate of customer retention, even during the pandemic.
Chick-fil-A’s efforts have boosted their metrics across all three core tenets of the JAM method:
- Journey: On average, Chick-fil-A outperforms its peers by nearly 10% across all stages of the customer journey, from awareness to recommendation. Consistently high customer advocacy rates have given Chick-fil-A the ability to reach widely into new markets.
- Advocacy: With a rare NPS of +50%, more than double its competitors, Chick-fil-A leads the Limited Service (LSR) Chicken category by a wide margin. Chick-fil-A’s advantage helps explain why it enjoys some of the industry’s highest single-store sales figures.
- Menu: The success of Chick-fil-A’s menu-oriented strategy is evident in its category metrics. The chain enjoys a +25% average advantage over its LSR chicken peers in consumer ratings across hot sandwich, chicken sandwich, and french fries.
Texas Roadhouse
To attract and maintain loyal customers in the ultra-competitive casual steakhouse segment, Texas Roadhouse has largely built its brand strategy around one concept: value relative to quality.
- Journey: On average, Texas Roadhouse outperforms its peers by 5% across the first three stages of the brand funnel: awareness, consideration, and trial. This aligns with the brand’s value-oriented strategy, which helps boost brand affinity for a broader swath of consumers. However, it doesn’t always ensure outperformance in long-term brand loyalty, since many value hunters will move on to the next attractive deal.
- Advocacy: Texas Roadhouse has an overall NPS of +47, 8 points above its casual steakhouse peer group. The difference is driven mainly by its “promoters,” indicating that a larger share of customers who try the brand view their experience as extremely positive.
- Menu: Food and beverage quality is a core tenet of the brand’s value proposition, which is reflected in its perception metrics. On average, Texas Roadhouse outperforms its peers by 6% across key attributes like freshness, taste, and ingredient quality.
Wawa
There are few better examples of consumer-centric brand strategy and the long-term value it can generate than convenience store chain Wawa. Wawa has long shaped its entire business model around the ever-changing demands of its customers and has often been at the forefront of innovation in the c-store space. It was one of the first c-store chains to focus on selling fresh, hot coffee, one of the first to incorporate a separate made-to-order hoagie counter, and in the early 2000s, Wawa became one of the first chains to implement self-service computer ordering systems, continually providing an improved menu and faster service.
Wawa’s customer-centric approach has remained a key driver of Wawa’s brand strategy today, which is evident in its brand metric performance.
- Journey: Driving loyalty in the c-store category is notoriously challenging due to constantly changing consumer preferences, as well as fierce competition from rival c-stores and even from competitive channels like QSRs. However, Wawa enjoys a 10% advantage over its major c-store competitors in both reach and frequency, with 25% of consumers visiting regularly and a whopping 9% visiting daily.
- Advocacy: Wawa has an NPS of +39%, 41 points higher than the average NPS of its c-store peer group. Eighty percent of Wawa customers rate their last visit experience as excellent or very good (compared to its peer average of 66%). The brand performs especially well in perceived food quality, ahead of its competitors by nearly 20%.
- Menu: When it comes to menu appeal, Wawa again leads the pack among c-stores. Fifty-six percent of consumers applaud the chain’s variety of appealing choices as “best in class,” which is 19% higher than the average for its peer group. Wawa really outshines in its made-to-order menu, which 69% of consumers consider top-notch (compared to 38% on average for competitive c-stores).
Key takeaways from the top chain restaurants
Understanding and evaluating when a brand performs well or falls short is critical to sustaining a powerful brand strategy. All three of these leading food brands are generating awareness, excitement, and loyalty among customers. Their ability to stand apart is rooted in their willingness to let data lead the way forward.
Access to data-driven intel is a game-changer for any food brand. With this kind of insight in hand, brands can make informed changes, identify leverage points, and address pain points for tremendous long-term success.
Explore how your brand can make finding and implementing these insights painless with BrandFingerprints.
