 EN | English UK
 DE | Deutsch
 ES | Español
 FR | Français
 IT | Italiano
The European foodservice market — spanning restaurants, hotels, and cafés, collectively known as the HoReCa sector — is one of the largest and most complex commercial landscapes on the planet. Yet most suppliers, distributors, and technology vendors are still navigating it on instinct.
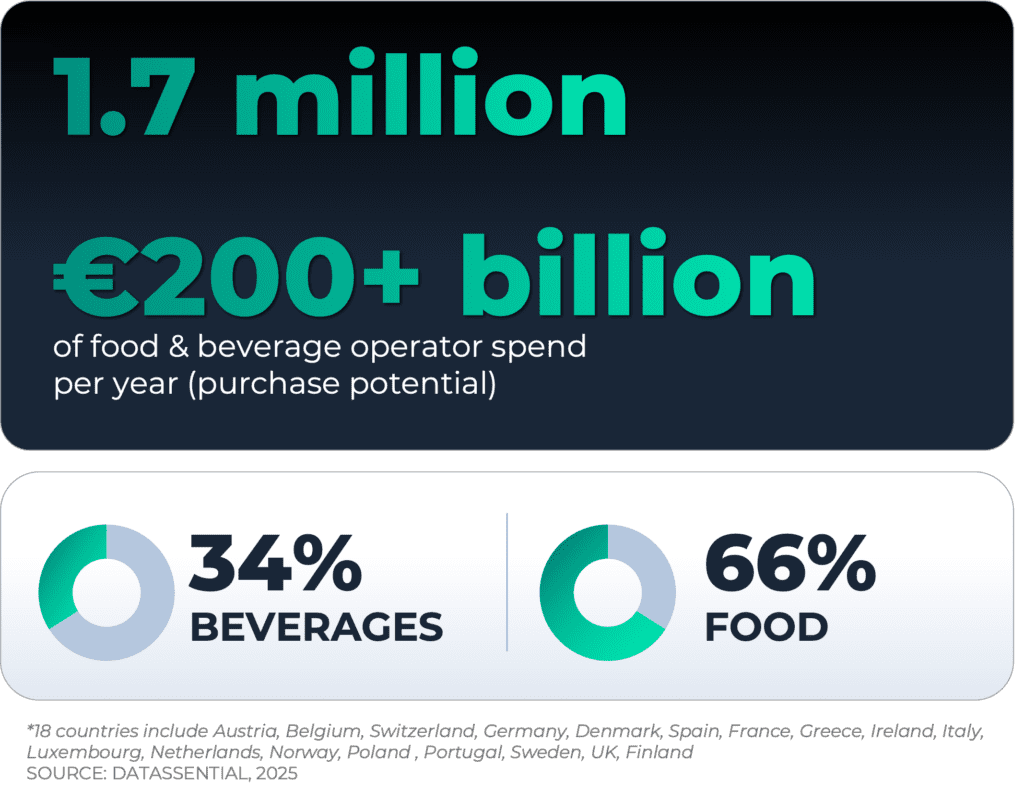
With more than €200 billion in annual operator food and beverage spend spread across the 18 European countries we reviewed in this report, the question isn’t whether the opportunity is there. It’s whether your team can find it faster than the competition.
In this post, we break down key findings from The European Foodservice Guide: Market Size, Purchase Potential and Segmentation — a free Datassential report — covering the European HoReCa market by size, segment, country, and operator type, and explaining how sales intelligence transforms raw market data into qualified pipeline.
NOTE: Data in this report reflects Datassential’s 2025 analysis of food and beverage operators across 18 European markets: Austria, Belgium, Denmark, Finland, France, Germany, Greece, Ireland, Italy, Luxembourg, Netherlands, Norway. All figures quoted in euros.
What is the European foodservice market, and how is it sized?
The European foodservice market refers to the collective purchasing activity of commercial food and drink operators — full-service restaurants, quick-service restaurants, bars, and hotels — across the continent.
Of the €200+ billion in annual operator spend across a region of 18 countries, food accounts for 66% and beverages for 34%. Beverages are a high-margin, fast-evolving category, making them a strategically important target for distributors and branded suppliers alike.
Market size is best understood not just through revenue, but through purchase potential: a bottom-up estimate of how much each individual operator spends on food and beverage annually.
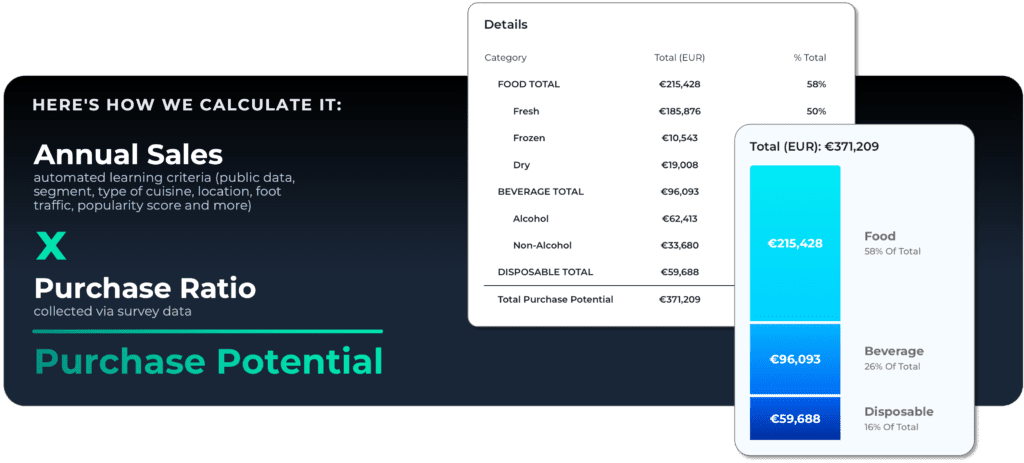
Calculating purchase potential
Datassential’s purchase potential methodology combines two inputs.
- First, annual sales figures are modeled using automated learning on public data signals: operator segment, cuisine type, location, foot traffic, and popularity score, among others.
- That sales figure is then multiplied by a purchase ratio — the share of revenue operators typically spend on food and beverage inputs, collected via survey data.
How is the European foodservice market segmented by operator type?
Not all operators are equal — and knowing which segments drive the most spend is the first step toward smarter territory planning.
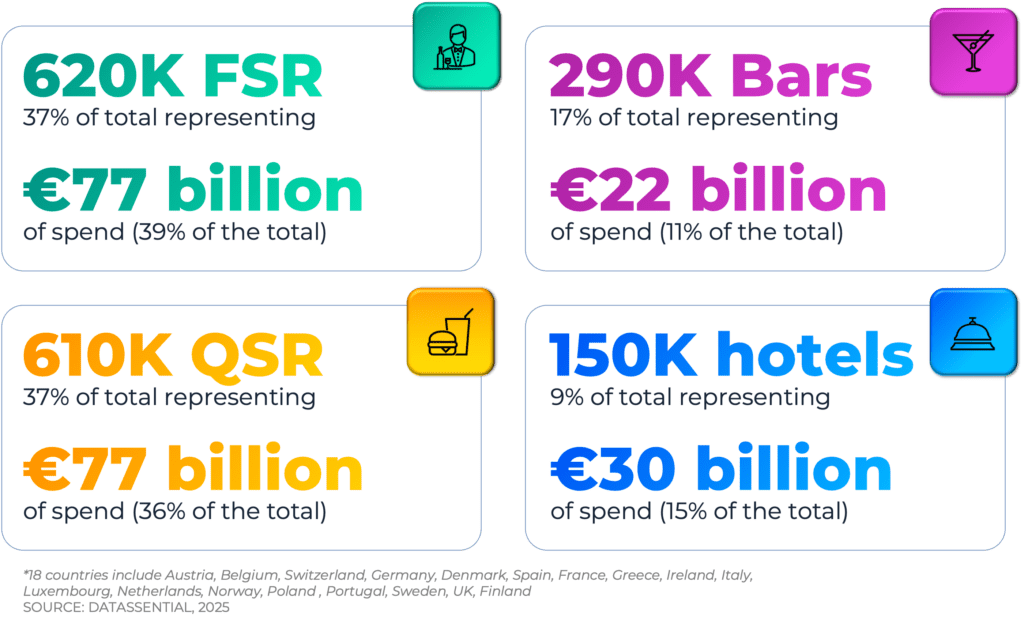
The European HoReCa market breaks down into four primary operator segments, each with distinct purchasing profiles:
- Full-Service Restaurants (FSR): 620K operators · €77 billion in annual spend · 37% of operators, 39% of total spend
- Quick-Service Restaurants (QSR): 610K operators · €77 billion in annual spend · 37% of operators, 36% of total spend
- Bars: 290K operators · €22 billion in annual spend · 17% of operators, 11% of total spend
- Hotels: 150K operators · €30 billion in annual spend · 9% of operators, 15% of total spend
The data reveals a striking insight: hotels represent just 9% of operators but punch above their weight at 15% of total F&B spend — making them a disproportionately high-value target on a per-account basis for sales teams willing to look past raw volume.
Where is the biggest foodservice sales opportunity in Europe?
Across the continent, five countries dominate — and their relative performance doesn’t always follow the logic of population size.
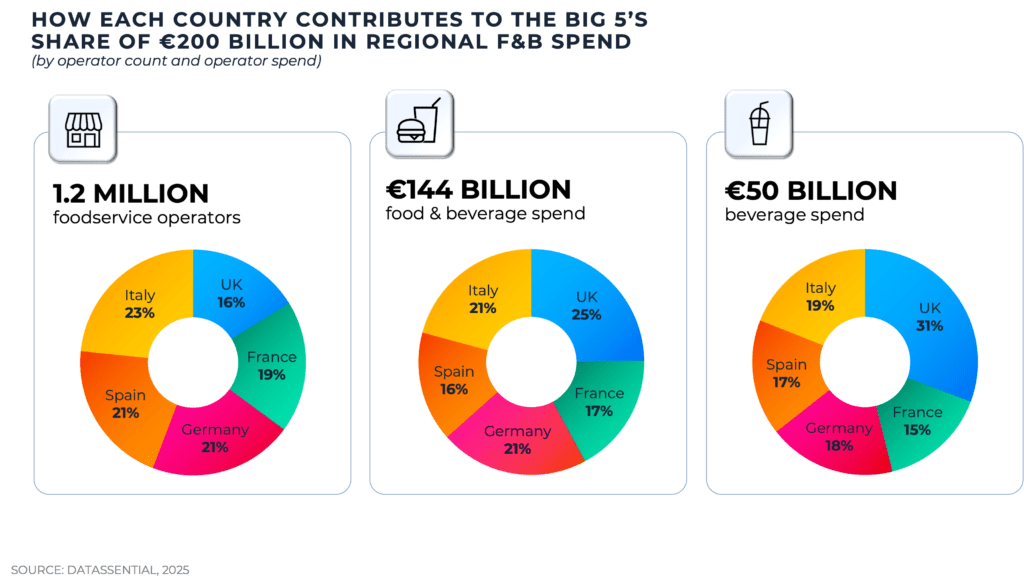
The ‘Big 5’ — the United Kingdom, Germany, Italy, France, and Spain — account for 72% of the total €200 billion in regional operator food and beverage spend, representing 1.2 million foodservice operators and €144 billion in annual purchasing, including €50 billion in beverage spend alone.

Country-level insights that challenge assumptions:
- Italy has the highest operator count among the Big 5 (23% of total), but its spend share is proportionally lower, signaling a market of many small operators with moderate per-unit purchasing.
- Spain contributes 21% of Big 5 operators but less than 16% of F&B spend, suggesting lower average purchase potential per account compared to peers.
- The United Kingdom does the opposite: just 16% of operators, but 31% of beverage purchases among the Big 5 — the highest spend concentration of any country in the group.
- France, despite having more operators than the UK, accounts for only 15% of beverage spend: a meaningful gap that should inform how resources are allocated across these two markets.
Why do independent operators matter most for European foodservice sales?
One of the most consequential findings in the European foodservice market data is the overwhelming dominance of independent operators — and what that means for sales strategy.
90% of foodservice operators in the Big 5 are independent, collectively representing 74% of the food and beverage market. That’s 1.2 million individual operators generating €144 billion in purchasing — none of them governed by centralized procurement. For sales teams, this means the path to revenue runs through thousands of individual relationships, not a handful of national accounts. Scale requires data.
Chains, while just 10% of operators, account for 26% of spend — meaning their per-unit purchasing power is more than twice that of independents. A sophisticated sales strategy targets both tiers, using spend-level data to prioritize effort within each.
How does foodservice market intelligence translate into sales pipeline?
Market size figures are compelling — but for a VP of Sales or a regional sales manager, the question is always the same: how do I turn this into booked revenue? The answer lies in operational sales intelligence: the ability to filter, rank, and act on individual operator data at scale.
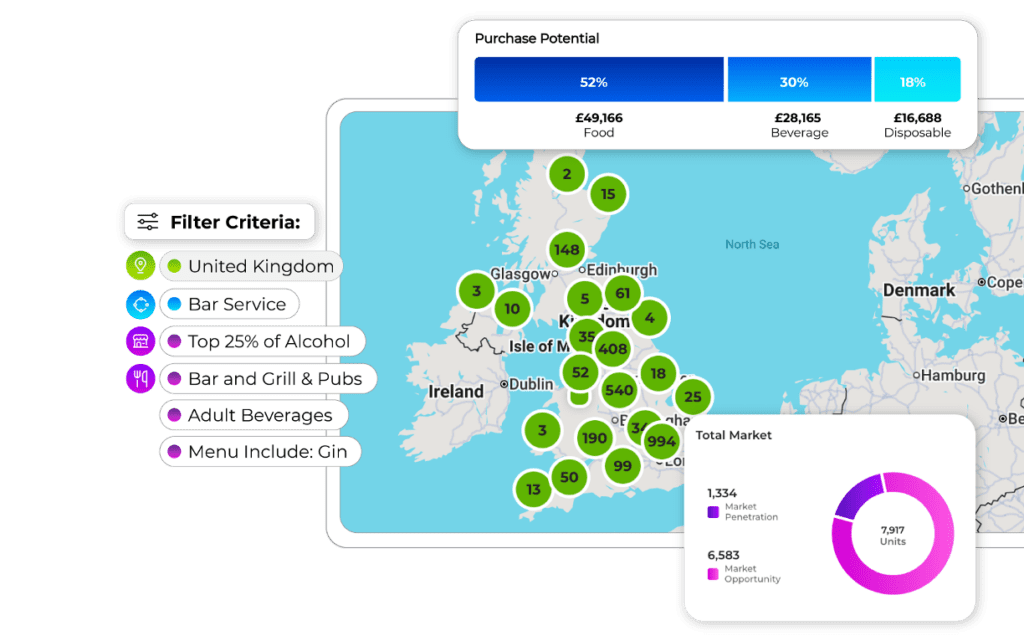
Filtering 3.2M+ operators across Europe
Datassential’s sales intelligence platform covers 3.2 million operators across Europe, filterable by 70+ industry attributes: purchase potential, segment, cuisine type, popularity score, menu items, and more.
That filtering capability is the operational link between macro market data and daily rep activity — transforming a €200 billion market map into a prioritised list of the highest-value accounts in any given territory.
Operator profiles as a sales enablement tool
Individual operator profiles give reps the context to personalise every sales conversation — including estimated spend, product category data, and competitive positioning.
Walking in prepared with that level of specificity is not just a competitive advantage. In a market of millions of operators, it is the only scalable path to revenue.