 EN | English UK
 DE | Deutsch
 ES | Español
 FR | Français
 IT | Italiano
Everyone talks about food trends. But there’s a meaningful difference between noticing that hot honey is everywhere and knowing three years ago that it would be. Only one allows you to make a proactive business decision.
At Datassential, trend prediction is disciplined. The methodology behind it is more rigorous and more actionable than most people realize — and understanding how it works changes how you approach every flavor and menu decision.
Here’s how it actually works, and what that means for your business.
What Is a Food Trend, Really?
Before getting into how to predict trends, it’s worth getting precise about what a trend actually is.
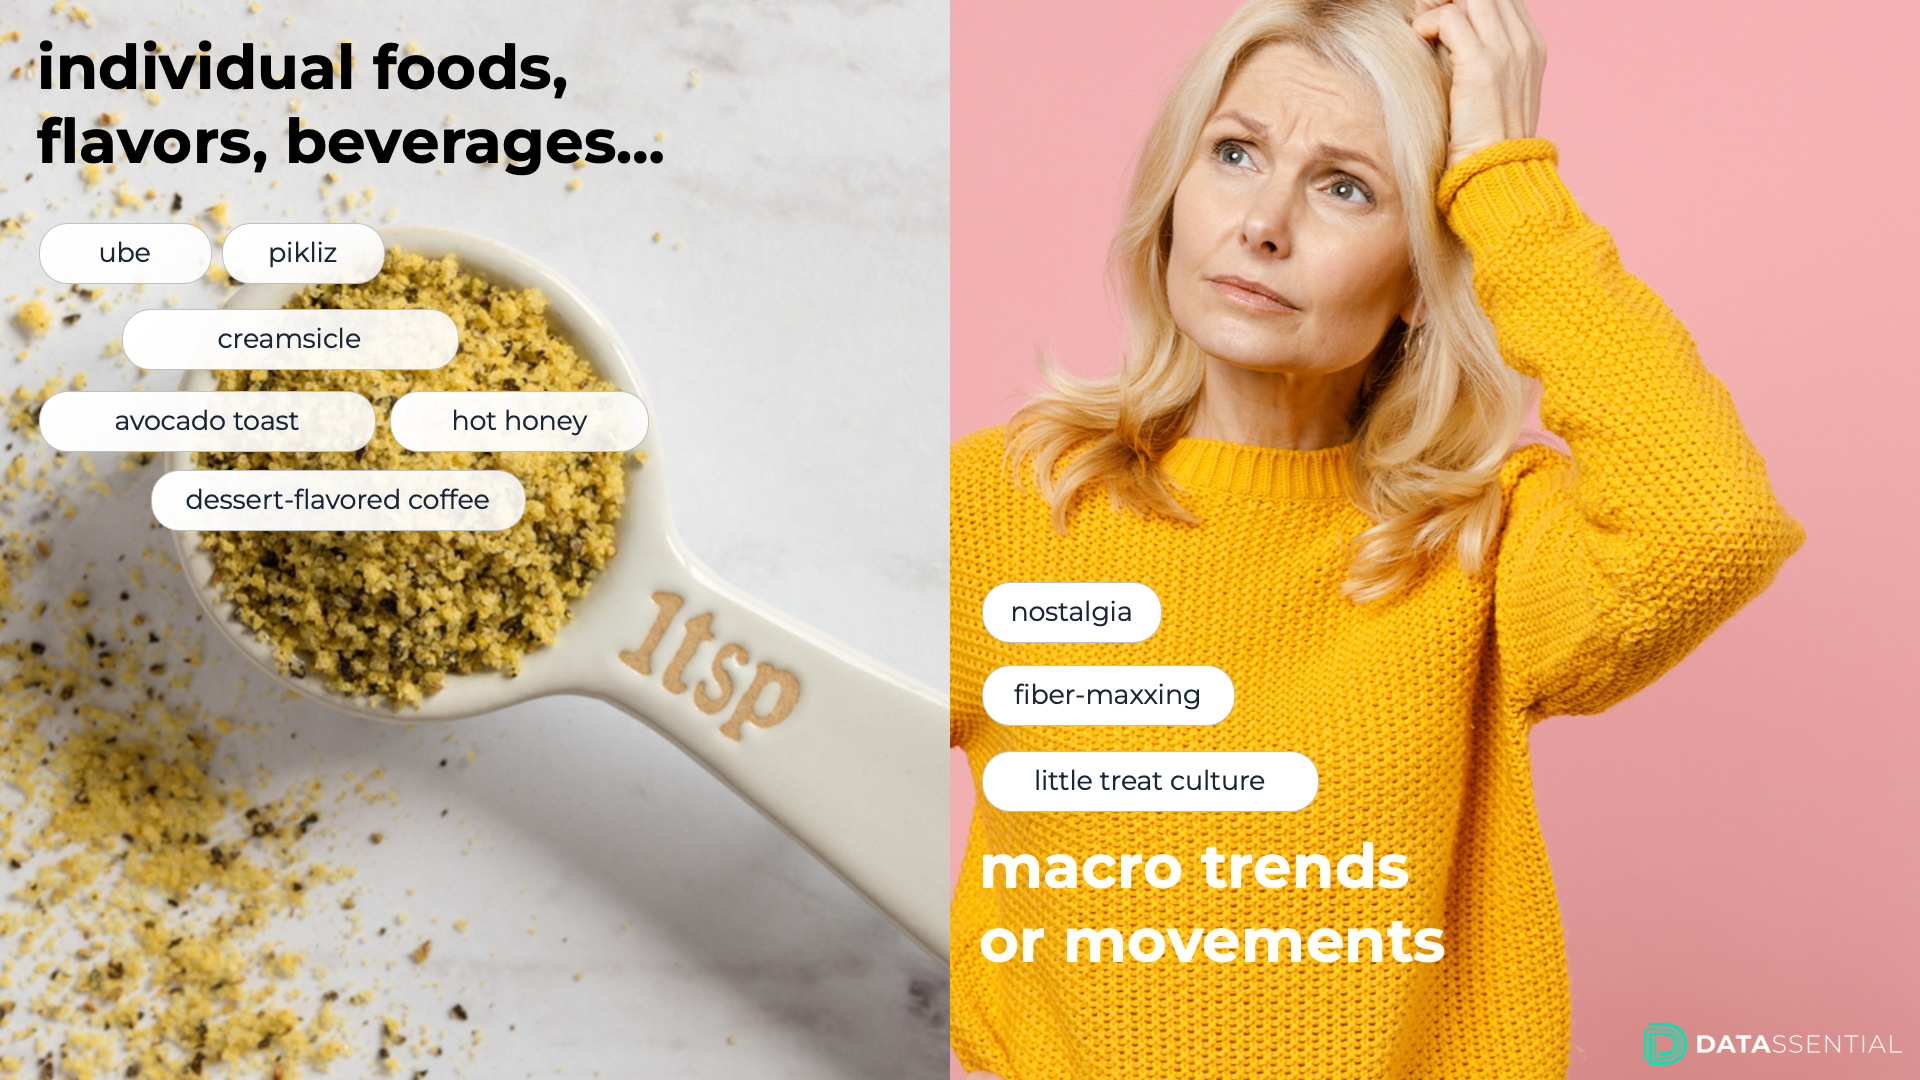
Datassential tracks food trends at two levels simultaneously. The first is specific: individual flavors, ingredients, and preparations like ube, hot honey, chili crisp, birria, etc. The second is macro: broader consumer movements and thematic trends like nostalgia, global exploration, and better-for-you indulgence, that provide the cultural momentum carrying those specific items forward.
The two levels are inseparable. Ube’s growth isn’t solely due to its own qualities. In addition to its naturally eye-catching purple hue and the fact that it’s approachable to Western audiences (it’s similar to a sweet potato but with subtly sweet, vanilla-like, nutty flavors), ube also sits at the intersection of multiple megatrends moving simultaneously: the broader evolution of Asian cuisine in the U.S. (and specifically the rise of Filipino food), natural colorings, and social-media-first visual appeal. Understanding that context allows you to understand where individual foods and flavors are in their lifecycle and discern whether or not it’s a trend worth acting on.
Trends also have a practical side that goes beyond innovation. Trend data – spanning overall presence and growth across social media, menus, and consumers – is equally useful for rationalizing SKUs, planning promotions, and building sales narratives. Trends also tend to have an opposite effect. When the smash burger grows, the thick pub burger takes a backseat. When birria takes off, we saw a drop-off in carnitas. So if your portfolio includes carnitas and you’re not tracking the rise of birria, or its impact on shredded beef demand, you’re working without the full picture.
The Science of Going Small
Here’s the counterintuitive part: the most valuable trend signal is often the smallest one.
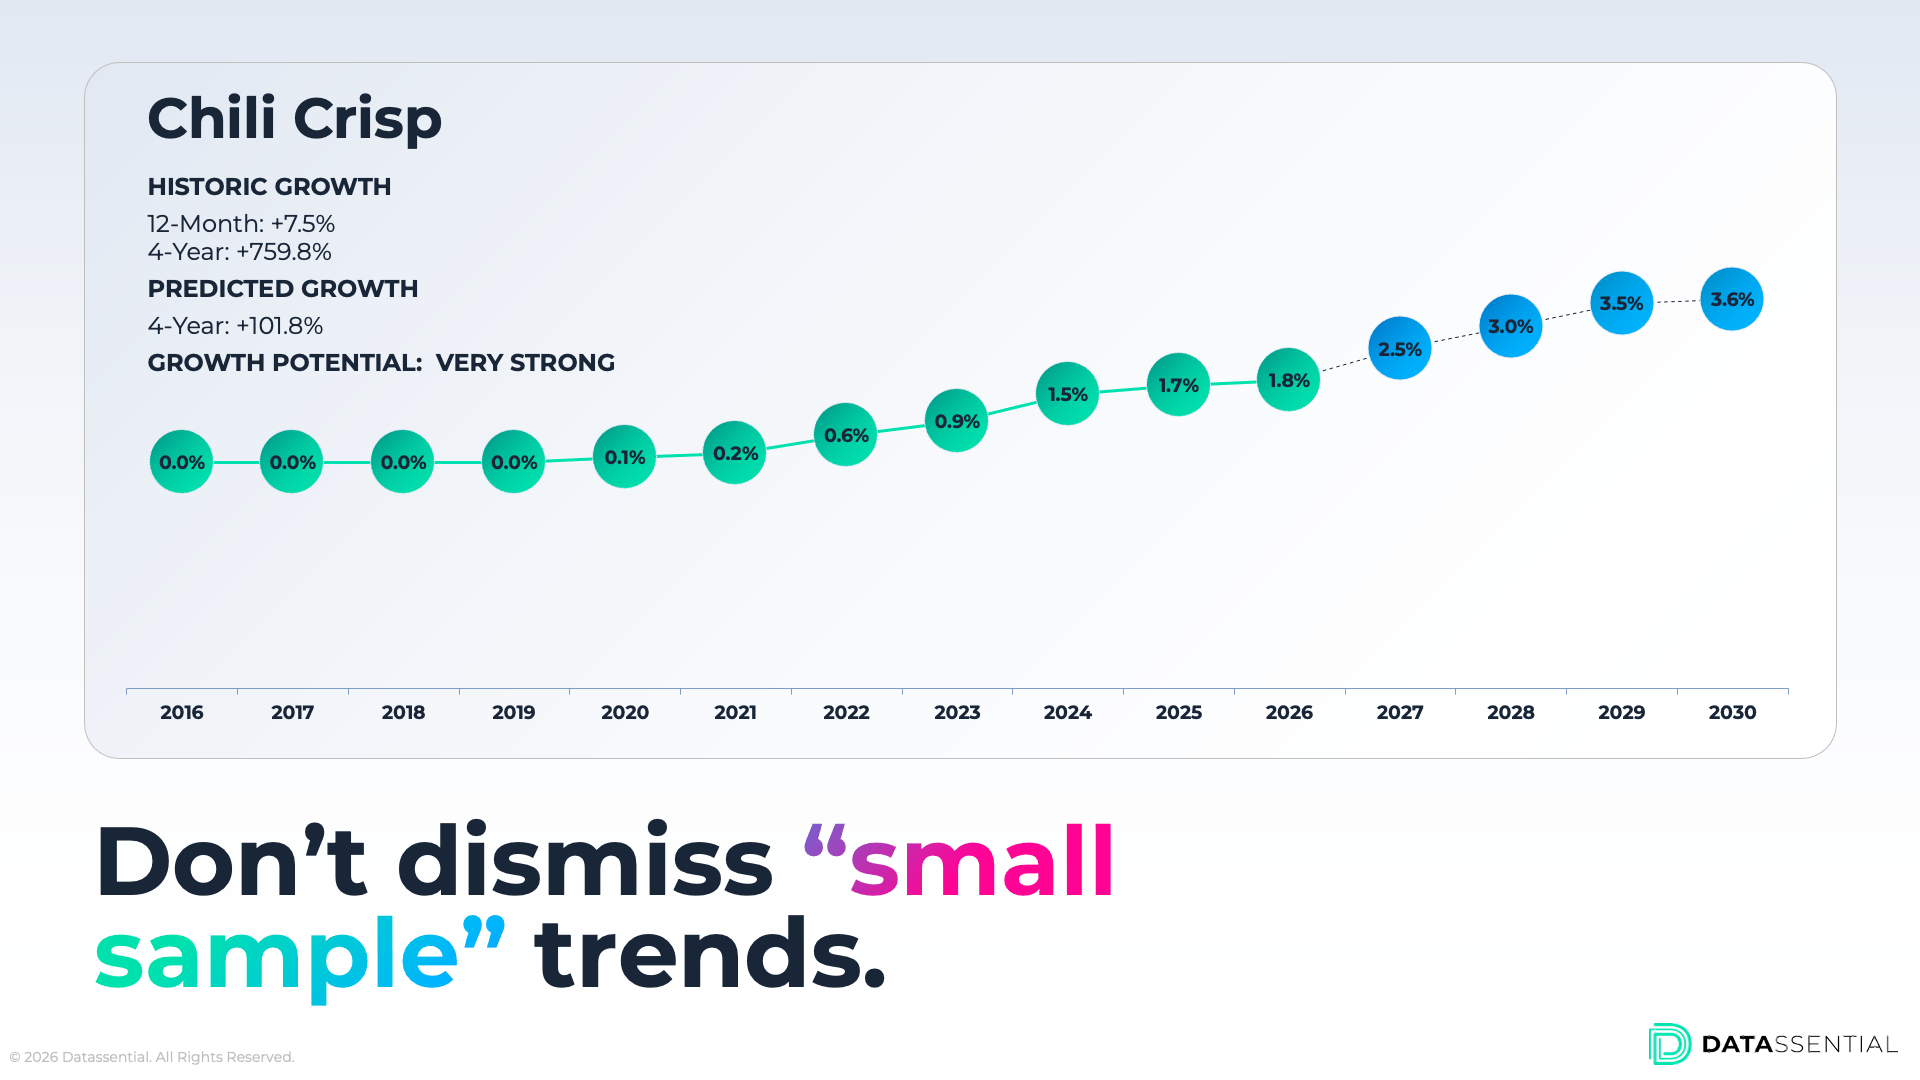
Most platforms default to showing ingredients on 1% or more of menus. But if you’re waiting until something hits 1% of menus to notice it, you’re already late. The signal worth tracking is the item at 0.1% that starts to double year over year.
Chili crisp illustrates this exactly. In 2020, it appeared on just 0.1% of U.S. menus — easy to dismiss, easy to miss. Then it doubled. Then it tripled. It kept growing. Today, it’s on nearly 2% of menus and projected to continue climbing. Anyone who caught that signal in 2020 had years of runway.
That’s why Datassential’s trendologists actively track below the default threshold — not because small sample sizes are reliable in isolation, but because the trajectory matters more than the absolute number. A tiny item with a steep growth curve and supporting megatrend momentum behind it deserves more attention than a mature item on 50% of menus with flat growth, especially if its corresponding growth in consumer awareness and social media mentions is also strong.
Four Signals That Separate
Real Trends From Noise
Going small is the first move. But not everything small is worth watching. These are the four signals Datassential uses to distinguish a trend from a coincidence.
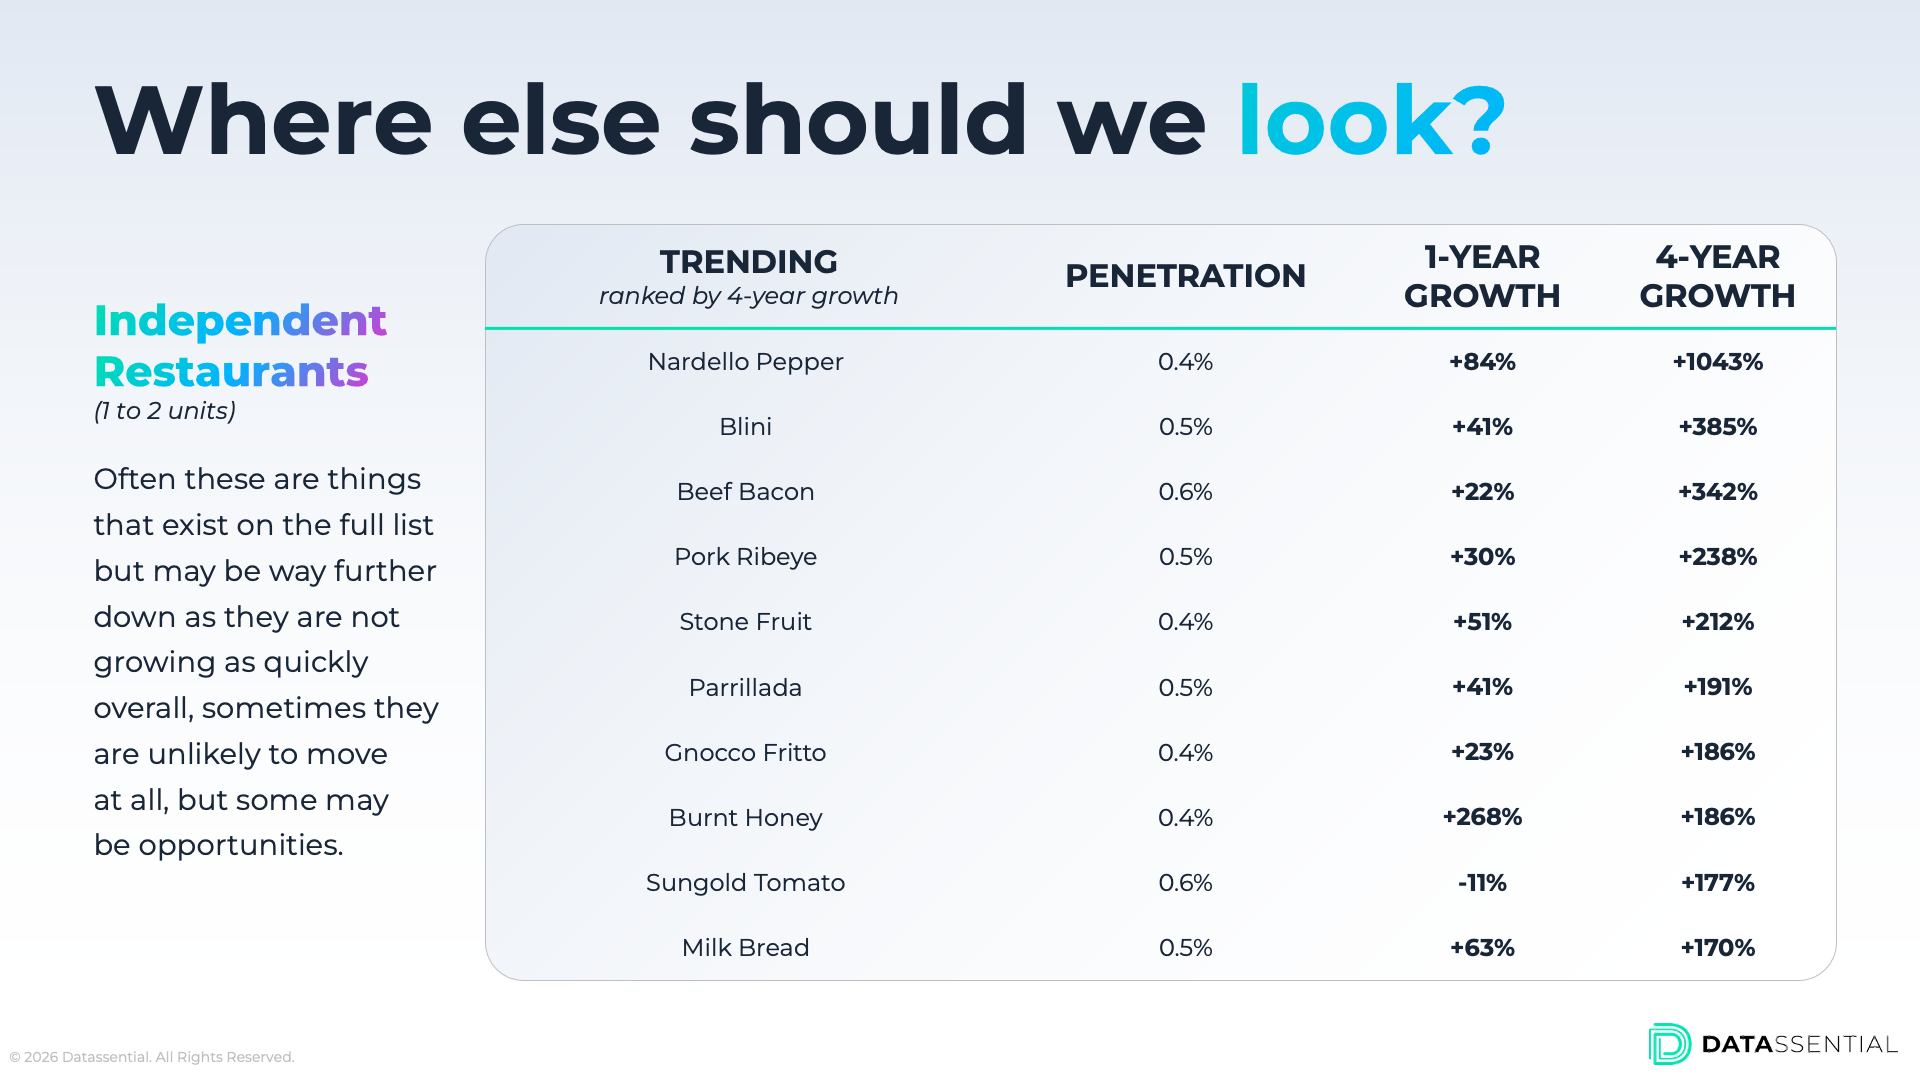
1. Independent restaurants first
Independents are the true leading indicators. They don’t need large supply chains, they can take risks, and they’re not bound by chain procurement cycles. When something is showing up consistently at single- and two-unit operators, it’s a signal that innovation is outpacing the mainstream. Below are a few great examples of trends showing up in this space right now:
| Blini | Tied to the rise of caviar |
| Beef Bacon | Growing as consumers look for more halal options |
| Burnt Honey | On the rise as consumers gravitate towards natural sweeteners |
2. Innovators before chains
Datassential tracks a specific segment of independent menus classified as “US Innovators,” restaurants whose job is to be first. Shirley Temple’s recent rise on menus is a clear example: U.S. Innovators adopted it first, and the rest of the industry followed within a year or two. The lag between innovator adoption and mainstream adoption is a predictable pattern, and it creates a reliable window for action.
3. Cuisine type as a leading indicator
Trends often start deep within a specific cuisine type before migrating outward. Birria was growing in Mexican restaurants well before it showed up on general market menus. Tracking what’s happening within a cuisine type, rather than across all menus, gives you a preview of what the broader market will want in 12 to 24 months.
4. Cross-validation across menu, consumer, and social data
A food or beverage emerging on menus with no consumer awareness is interesting. A food or beverage whose consumer awareness and social mentions are growing is a strong indicator of a true trend. Datassential validates across all three data sources simultaneously. A great example of a meaningful emerging trend today? Hojicha appears on less than one percent of menus today, but it’s growing across social mentions and showing rising awareness among younger and Asian consumers. The menu data is the signal; the consumer and social data confirm it’s not a fluke. This can also work when social or consumer data provides the signal; the key is to analyze the data holistically.
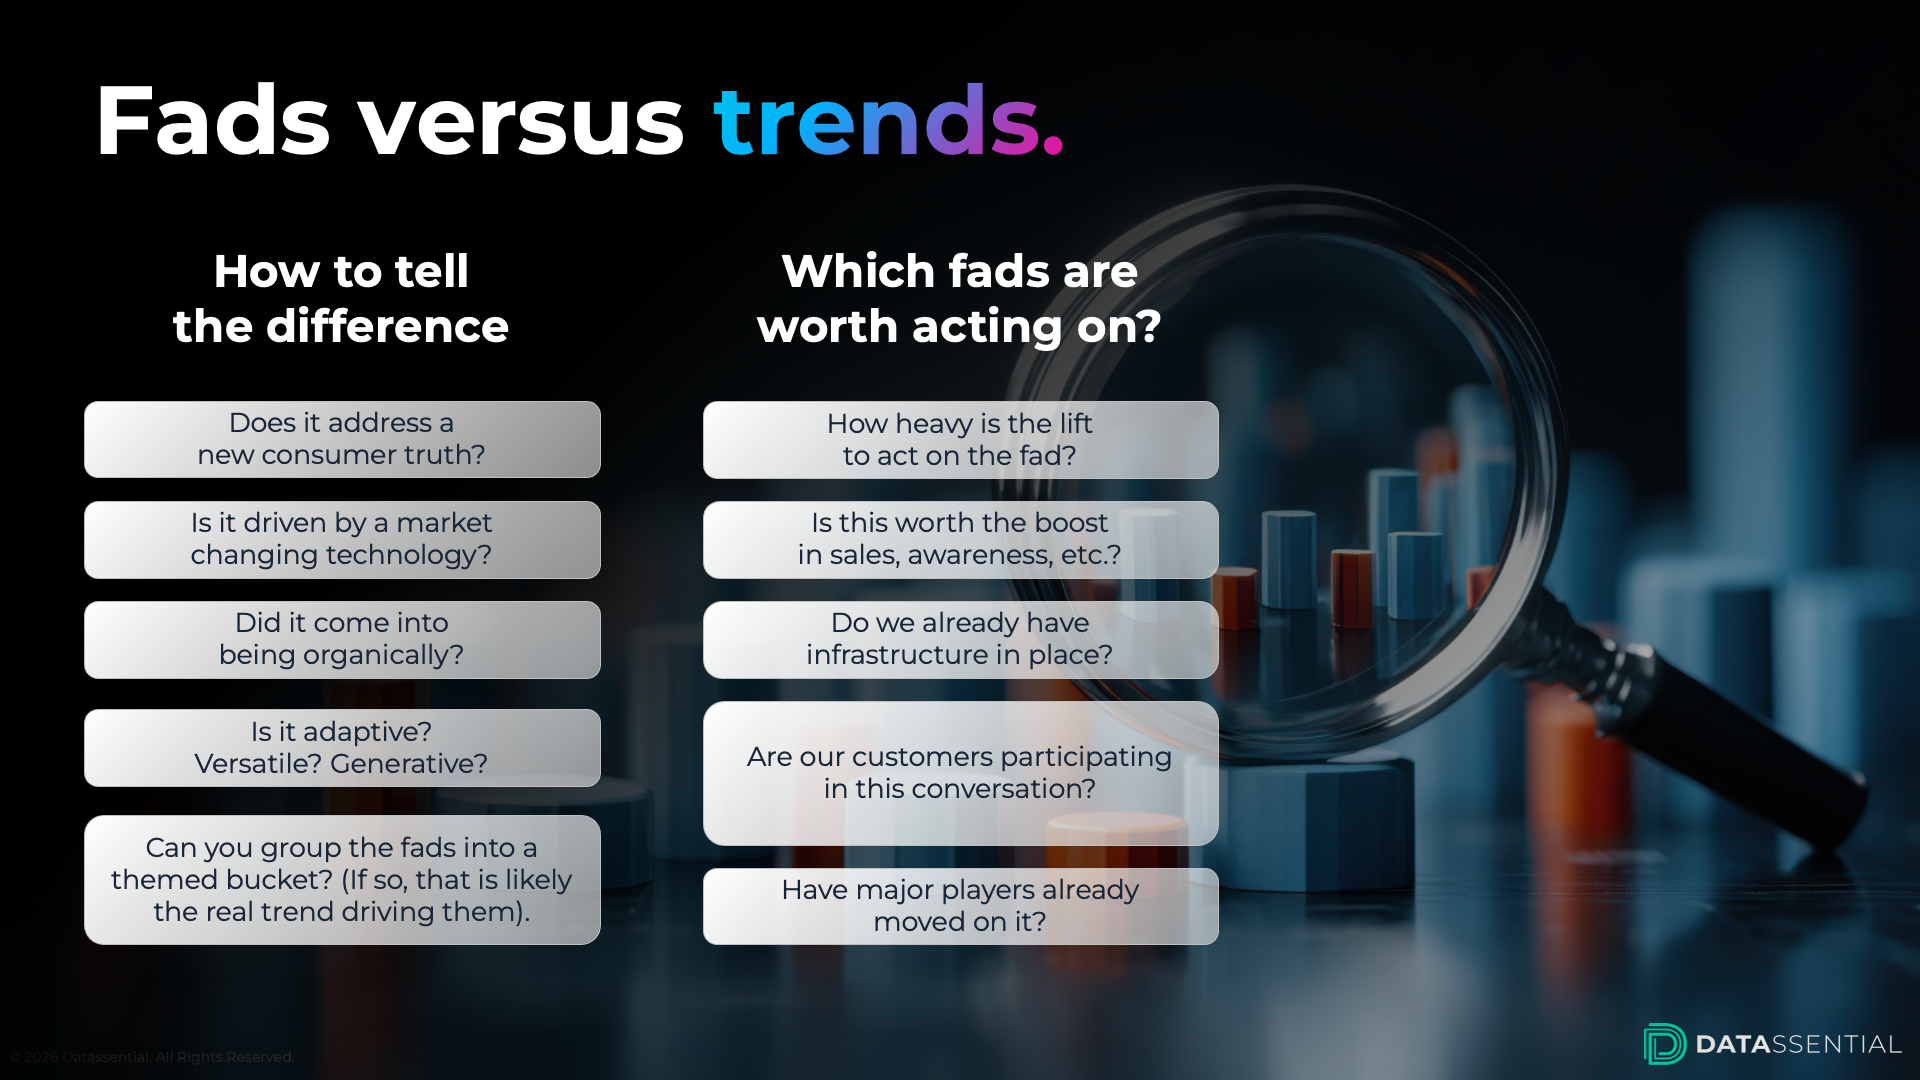
Fads Are Not the Enemy
The fad vs. trend debate sometimes gets framed as a question of legitimacy, as if only “real” trends deserve attention, but that’s the wrong framing.
Fads are real market signals. They just require a different response. The question isn’t whether something is a fad or a trend. It’s whether it’s an easy operational lift, whether it supports your brand narrative, and whether it can drive a social moment even if it doesn’t drive long-term volume. Sushi burritos may never be a permanent menu staple, but the broader trends they signaled (cultural mash-ups and the evolution of Asian cuisine) very much are.
More often, what looks like a fad is actually a collection of related moments that, taken together, indicate the start of something larger. That’s how trends emerge: as clusters of seemingly unrelated fads coalescing around a common consumer truth.
Why Your AI Tool Might
Be Getting Trends Wrong
This is where it gets important.
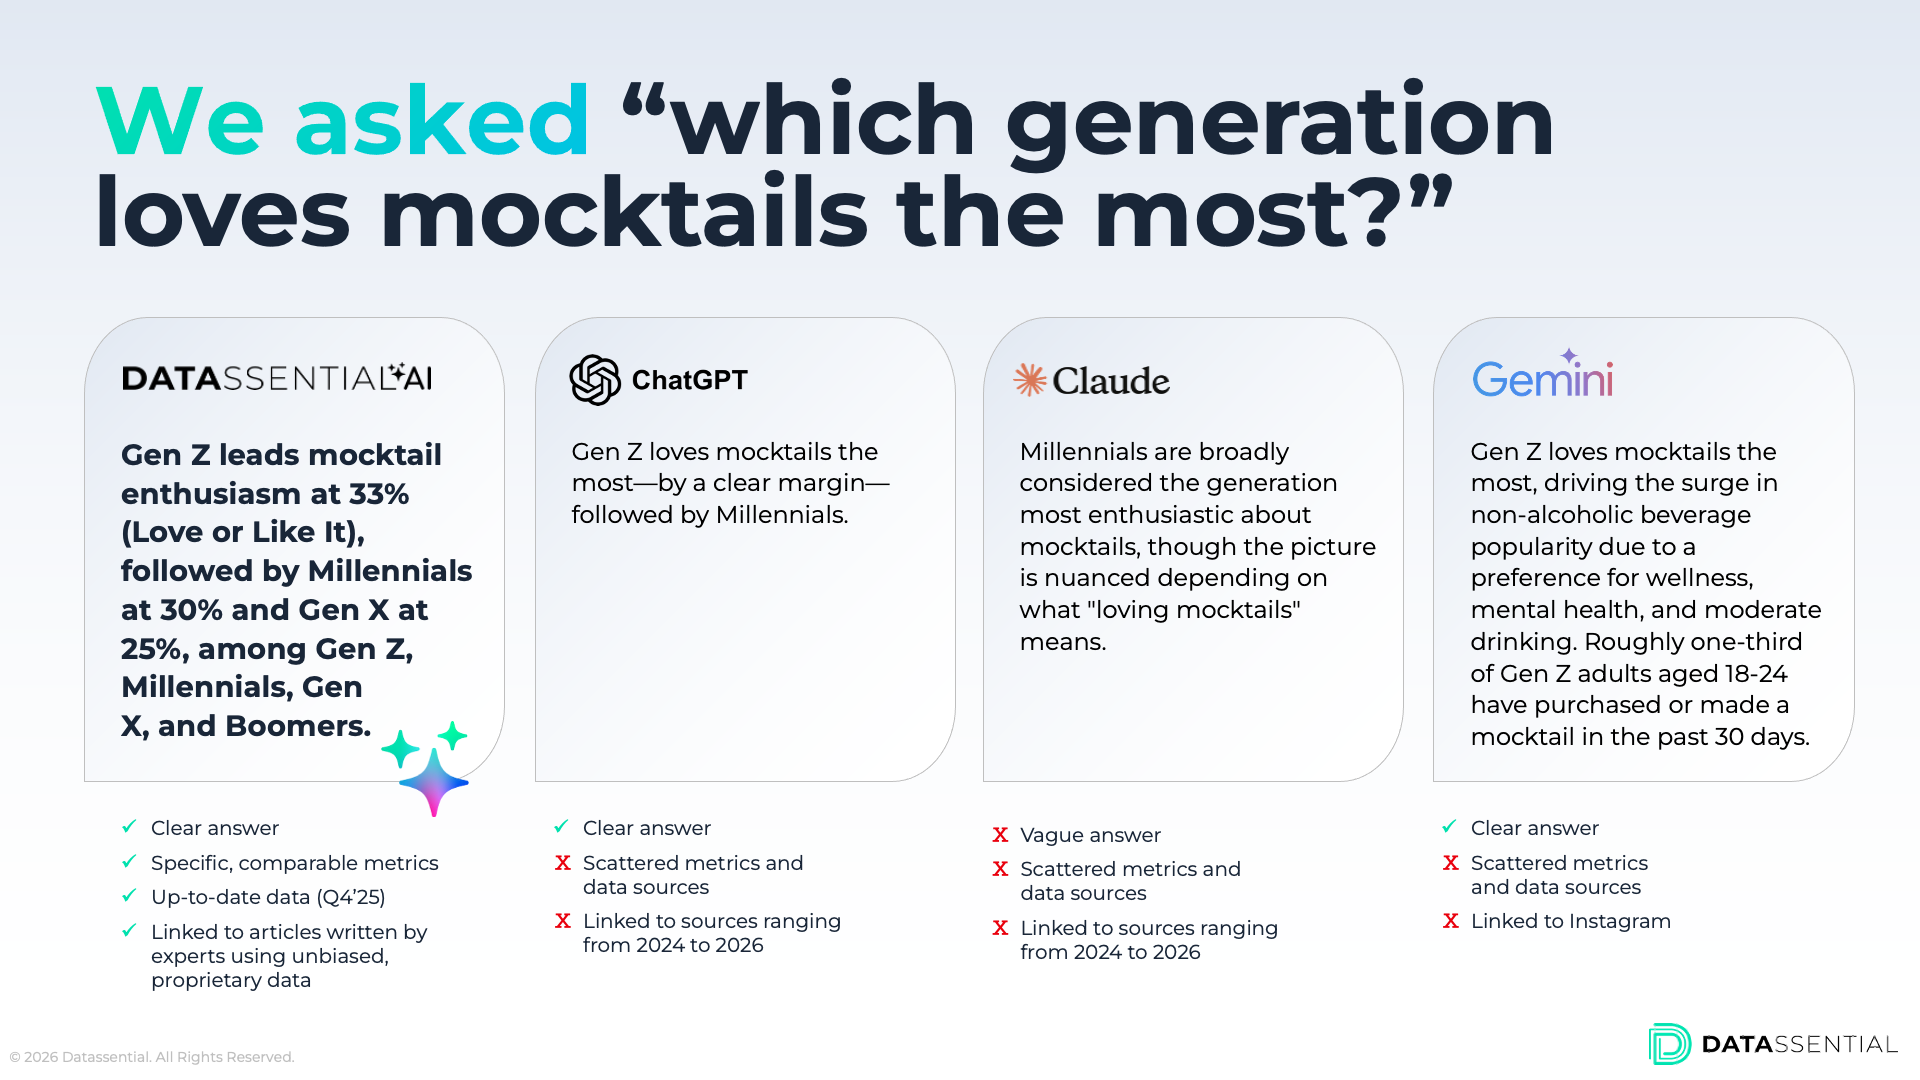
As AI becomes embedded in food and beverage workflows, more teams are asking their LLMs trend questions. And the results are inconsistent in ways that matter. To illustrate this, Datassential ran a simple test: asking which generation loves mocktails the most to four different sources — Datassential AI, ChatGPT, Claude, and Gemini.
Three of the four got the right answer (Gen Z). One did not. That’s not a rounding error — that’s a divergent business recommendation depending on which tool your team happened to use that day.
More problematically, when the answers were traced back to their sources, the underlying data ranged from blog posts to Instagram content, with articles spanning multiple years and lacking a consistent methodology for comparing across demographics.
Your AI is only as good as the data it’s built on. Generic LLMs are trained on publicly available internet content — scraped, inconsistently structured, and often outdated. They can produce fluent, confident-sounding answers about food trends. What they can’t do is tell you whether consumer awareness of a flavor is growing or plateauing (or by how much), which generations over-index for a specific product affinity, or what the future growth projection for an ingredient looks like based on meticulously coded, longitudinal menu tracking.
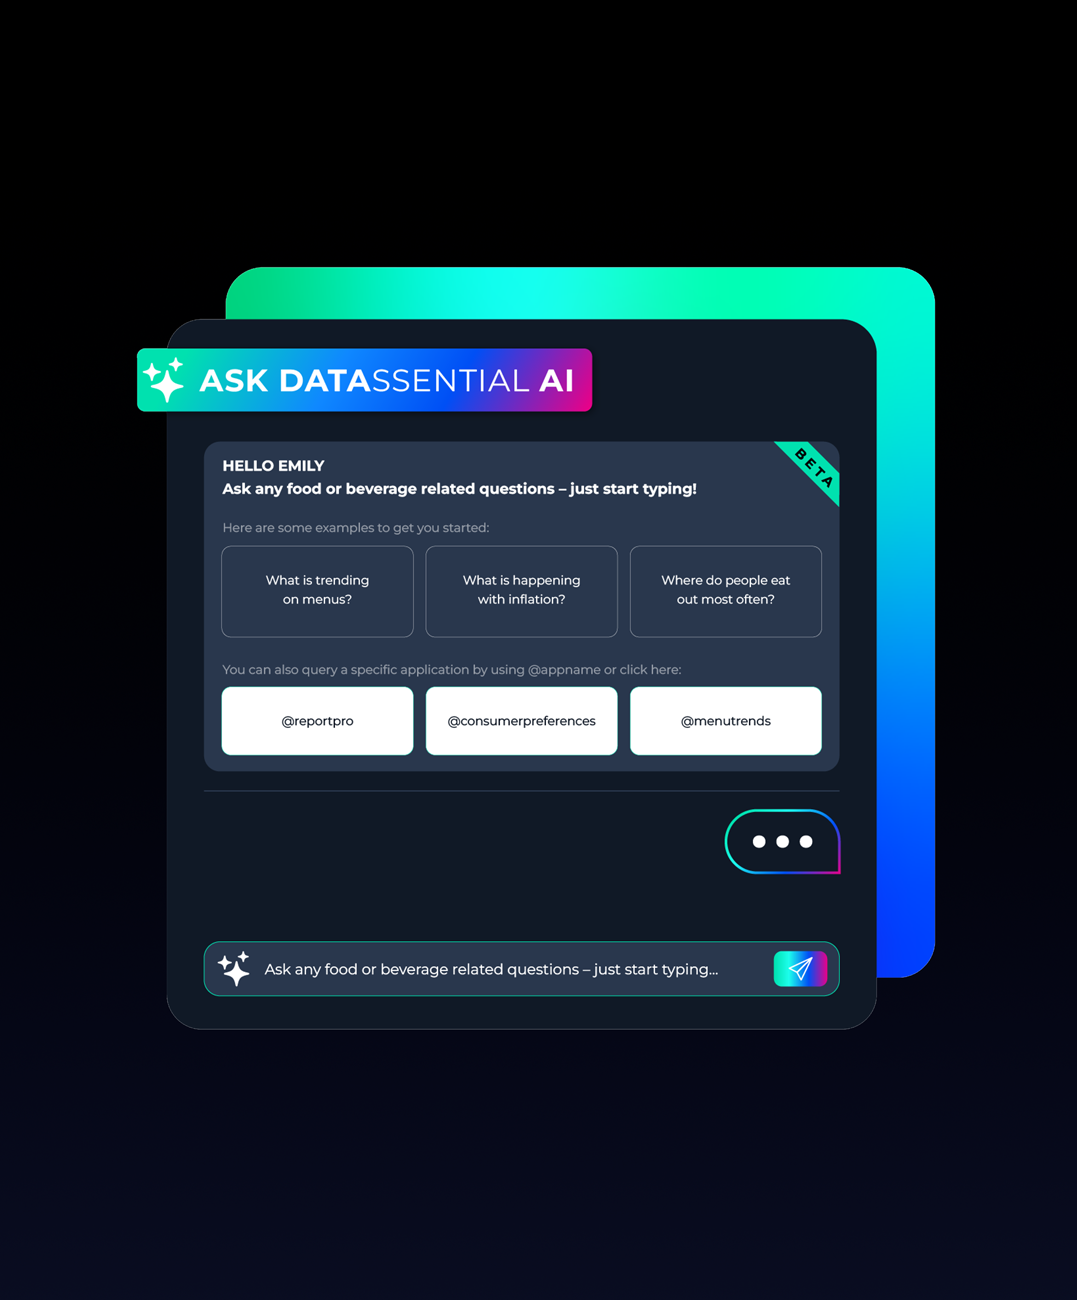
Datassential AI is built on a fundamentally different foundation: 500,000+ consumers surveyed annually, 20+ years of menu data, and decades of expert classification by food and beverage specialists. The answers it produces aren’t just more accurate; they are transparent. You can see the underlying data, cut it by demographic, and go from a chat response directly into the tool to verify the full picture.
That’s the difference between an answer that sounds right and an answer you can defend in a business review.